Align operations, quality, HR, and contract management on a shared view. With our SmartReports and Workspaces, turn your data into decisions: drag-and-drop, ready-to-use templates, client sharing, multi-period comparisons…
• Drag-and-drop: build your dashboards in minutes
• SmartReport Gallery: ready-to-use business templates
• Workspaces: shared internal and client portal
• Comparable Data: sites, clients, periods…
• Automation: reminders and escalations when deviations are detected
+12pnts
in customer satisfaction on multi-site contracts
99%
SLAs met thanks to automatic reminders
-40%
on the average request resolution time
-35%
of non-conformities and contractual penalties
+20%
field productivity per agent per day
-30%
HR costs resulting from unplanned overtime
-18%
average cost per intervention (sqm or ticket)
-0,3 à 1,2 tCO2
émis par an grâce au zéro papier via des formulaires digitalisés
Build and maintain your dashboards with no coding required
Open, connected, and ready to enrich your analyses
Your data doesn’t live in a silo. MoveWORK Flow connects to your business tools, your Business Intelligence solutions, and your external data sources for enriched, centralized management.
Native BI connectors
Plug your MoveWORK Flow data into your advanced analytics solutions (Power BI, Tableau, Qlik, Looker…) to combine your operational KPIs with your financial, HR, or strategic indicators.
Secure, real-time APIs
Integrate MoveWORK Flow into your existing systems thanks to our complete, authenticated, and fully documented REST API.
Our interoperability allows you to synchronize interventions, scheduling, time tracking, IoT, and much more.
Automated imports and data collection
Enrich your dashboards with external data through assisted CSV import or real-time collection via webhook triggered each time a SmartReport is displayed. Your indicators are always up to date, with no manual action required.
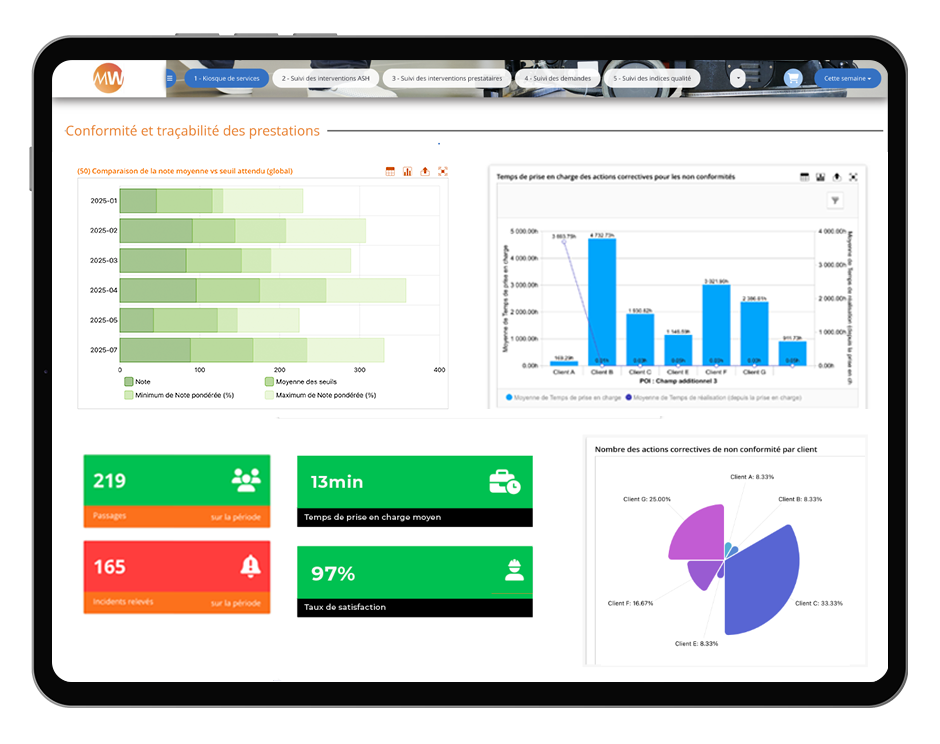
SmartReports to manage your operations
Over 30 pre-configured chart templates
Quality (8+ templates)
Quality control scores
Non-conformities and SmartKPIs
Completion rates by type, site, and client
Sampling and guided requalifications
Interventions & HR Monitoring (4+ templates)
Planned vs. actual attendance per worker
Hours worked, absences per day/team
Variances & tolerances (HR compliance)
Satisfaction (3+)
Monthly satisfaction trend (smiley)
Votes / comments by site or service
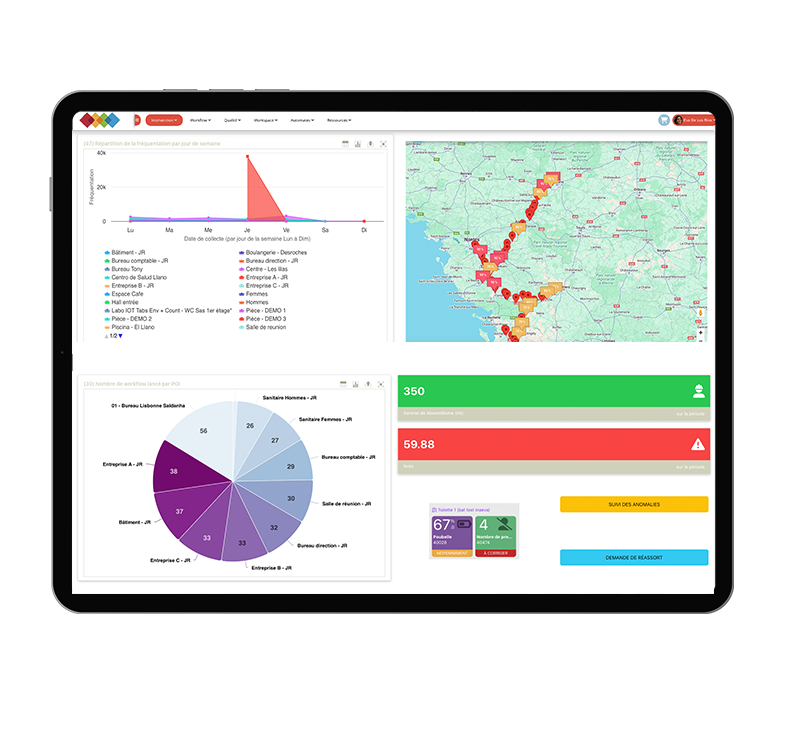
Intervention (operational)
Intervention frequency by POI / client
Priorities & emergencies, reassignments
Workflows (6+)
Steps in progress / overdue / escalated
Time per step, bottlenecks, deviations vs. SLA
Traffic & IoT
Counting, fill-level sensors, air quality
Correlation between footfall ↔ requests ↔ restocking