Fast, intuitive, and real-time… That’s the promise delivered by the new dashboards of the MoveWORK Flow platform! After months of development, this new analytics module transforms your data into decisions effortlessly and in just a few clicks. No need to be an expert to leverage your performance indicators and activity data. Discover our new automated dashboards!
Data management : a way to optimize operational performance
How can you make the right decisions if you have no visibility into what is happening on your sites? In a complex and constantly evolving professional environment, companies must rely on reliable data to optimize their operations. Collecting, analyzing, and interpreting data has become a key driver of efficiency and a necessity for reducing costs.
And MoveWORK understands this perfectly! Our technical experts have developed innovative dashboards that turn management into your competitive advantage—without draining your energy. Data interpretation is no longer just about tracking indicators; it is now more agile, responsive, and efficient.
- Real-time visibility: Manage better to act faster
With our new dashboards, access to up-to-date indicators allows you to immediately identify deviations from your objectives (delays, extra costs, incidents). Automated alerts flag anomalies and enable you to instantly activate relevant action plans.
- Resource optimization: Allocate better to ensure service quality
MoveWORK dashboards help you optimize workforce allocation based on real needs and peak activity times. By intervening at the right time and place, you reduce waste, unnecessary travel, excessive material consumption, and associated costs.
- Anticipation and prevention: From reaction to proactivity
Don’t just react to challenges—anticipate them! Thanks to trend analysis, you can detect warning signs before they become problems. Is there a surge in traffic during certain periods? Reinforce your workforce! Is dissatisfaction higher in a particular building? Increase quality control in that area! Precise data analysis allows you to align your strategic decisions with real-world conditions and intelligently adjust your intervention processes.
Dashboard which make your day to day easier
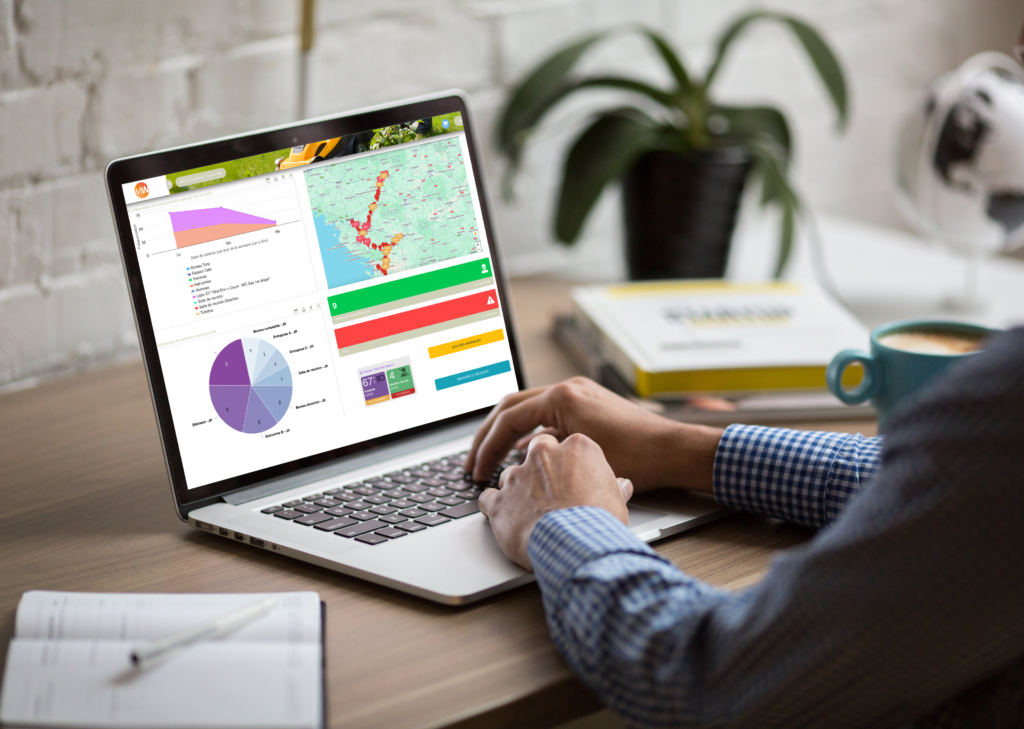
No more Excel spreadsheets with hundreds of incomprehensible data points and limited-design charts! No more hours wasted searching for information across dozens of files! No more struggling to find connections between your different indicators! MoveWORK has developed dashboards that clearly model all your operational flows without requiring any effort.
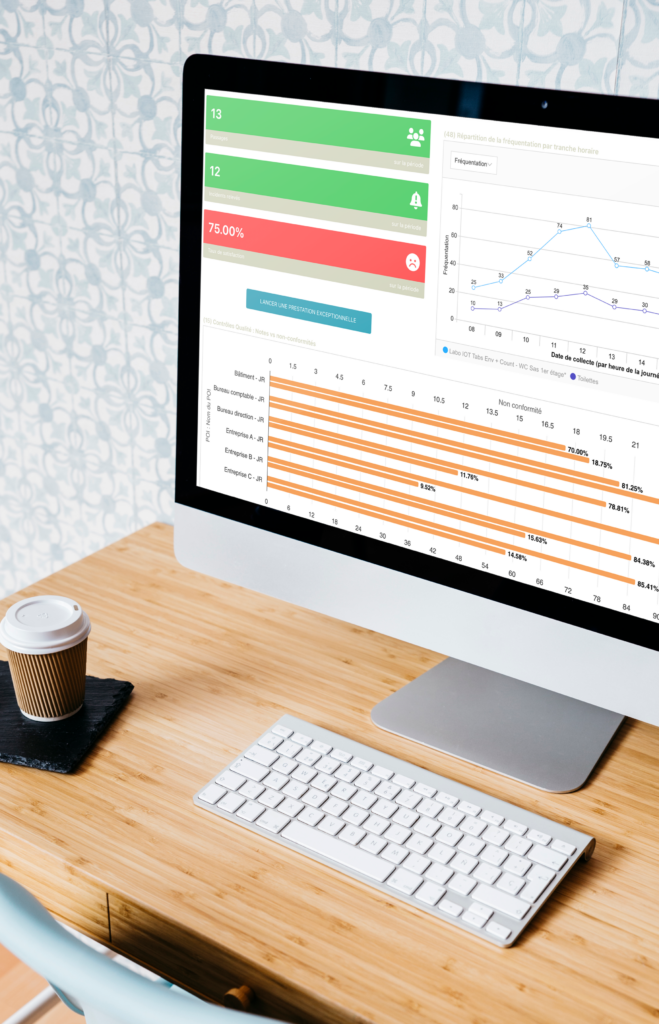
Interactive charts, real-time mapping, customizable color codes… Our new dashboards instantly reveal anomalies, recurrences, and unexpected correlations. Access a gallery of ready-to-use models that automatically centralize the right data in the right place. Designed to meet your operational and strategic challenges, the new MoveWORK dashboards adapt to all your needs:
-
Intervention traceability: Monitor the execution of your services and ensure continuous compliance with your contractual commitments (attendance, working hours, tasks completed, incident resolution, response times, etc.).
Environment and satisfaction: Access environmental data from your client sites (air quality, humidity, odors, etc.), monitor site traffic, and identify opportunities to improve customer satisfaction.
Quality and compliance: Manage your quality standards and monitor non-compliance (quality control scores, compliance rates, risk pyramid, events by type, etc.).
Workflow tracking: Track the progress of corrective actions and manage customer requests or exceptional interventions.